How to transform data with Amazon SageMaker Data Wrangler
Data transformation is a process in machine learning that involves converting raw data into a suitable format for model training and analysis. It's akin to preparing ingredients before cooking a meal - the better the preparation, the tastier the final dish...
Data transformation is a process in machine learning that involves converting raw data into a suitable format for model training and analysis. It's akin to preparing ingredients before cooking a meal - the better the preparation, the tastier the final dish.
Why is Data Transformation Necessary?
Machine learning models, like humans, learn best from well-prepared data. Raw data often contains inconsistencies, noise, and biases that can affect model performance. Data transformation addresses these issues, making the data more suitable for model training.
AWS SageMaker Data Wrangler is a visual interface that helps manage complex data preparation and processing for machine learning applications. It helps data scientists and engineers connect to various data sources, including Amazon S3, Athena, Redshift, AWS Lake Formation.
Data Wrangler basic functionality is very intuitive. A new user without experience can set up a simple data flow in less than an hour. The complex processing requires expertise, though. More than 300 built-in transformations need time to be mastered.
The main benefits of Data Wrangler are
- Visual Interface: It provides a user-friendly visual interface where you can drag and drop data, apply transformations, and see the results instantly.
- Built-in Transformations: It has a library of pre-built transformations (300+) like data cleaning and formatting, image manipulation, etc. You can apply these with just a few clicks. It supports custom transformation with Python, Pyspark, and Pandas.
- Automated Insights: The tool can automatically detect anomalies, missing values, and outliers in your data, saving you time and effort.
- Scalability: SageMaker Data Wrangler can handle large datasets and complex transformations, making it suitable for real-world projects.
- Integration: It natively integrates with other SageMaker services, allowing you to build end-to-end machine-learning pipelines.
Now let's see a real example of a Gym Membership Exercise dataset (https://www.kaggle.com/datasets/valakhorasani/gym-members-exercise-dataset/data)
1) Create an S3 bucket and upload the dataset. In this example, we use datawrangler-fca-demo.
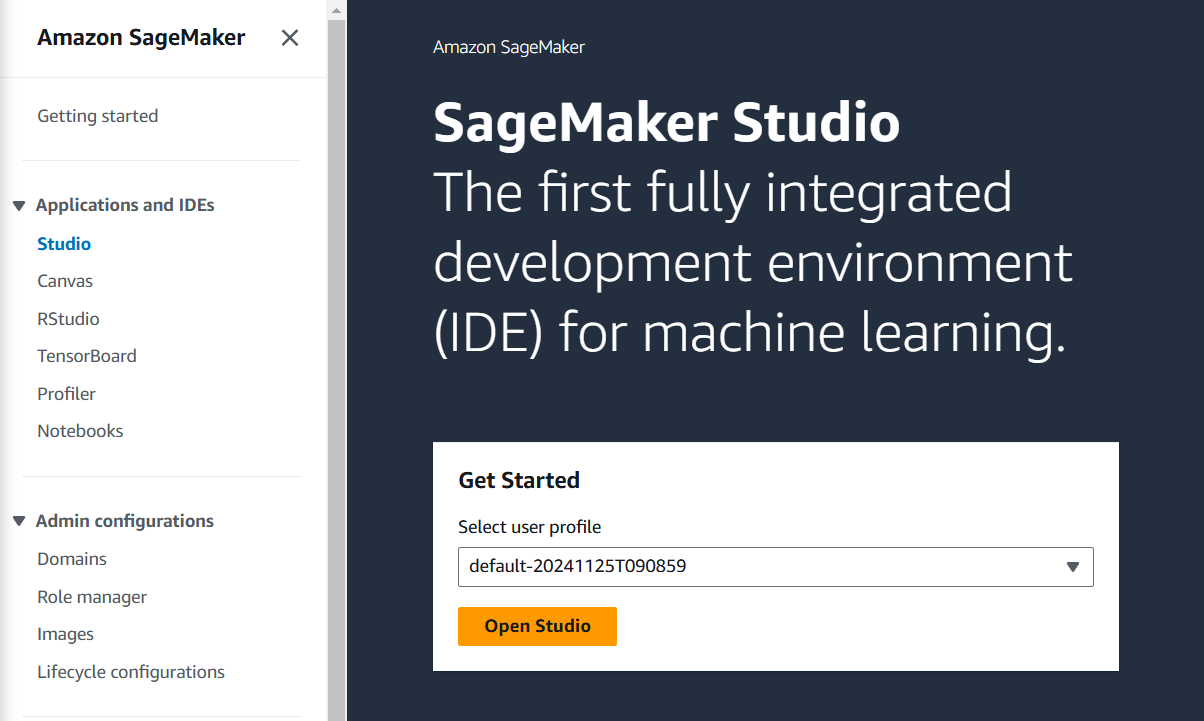
2) In the AWS console, open "Amazon SageMaker", click on the "Studio" menu, and then "Open Studio". You will be asked to create a profile if you have never done it before. Stay with a default value and click Create. It will take about 3 minutes.
3) Expand "Data" on the left menu and click "Data Wrangler".
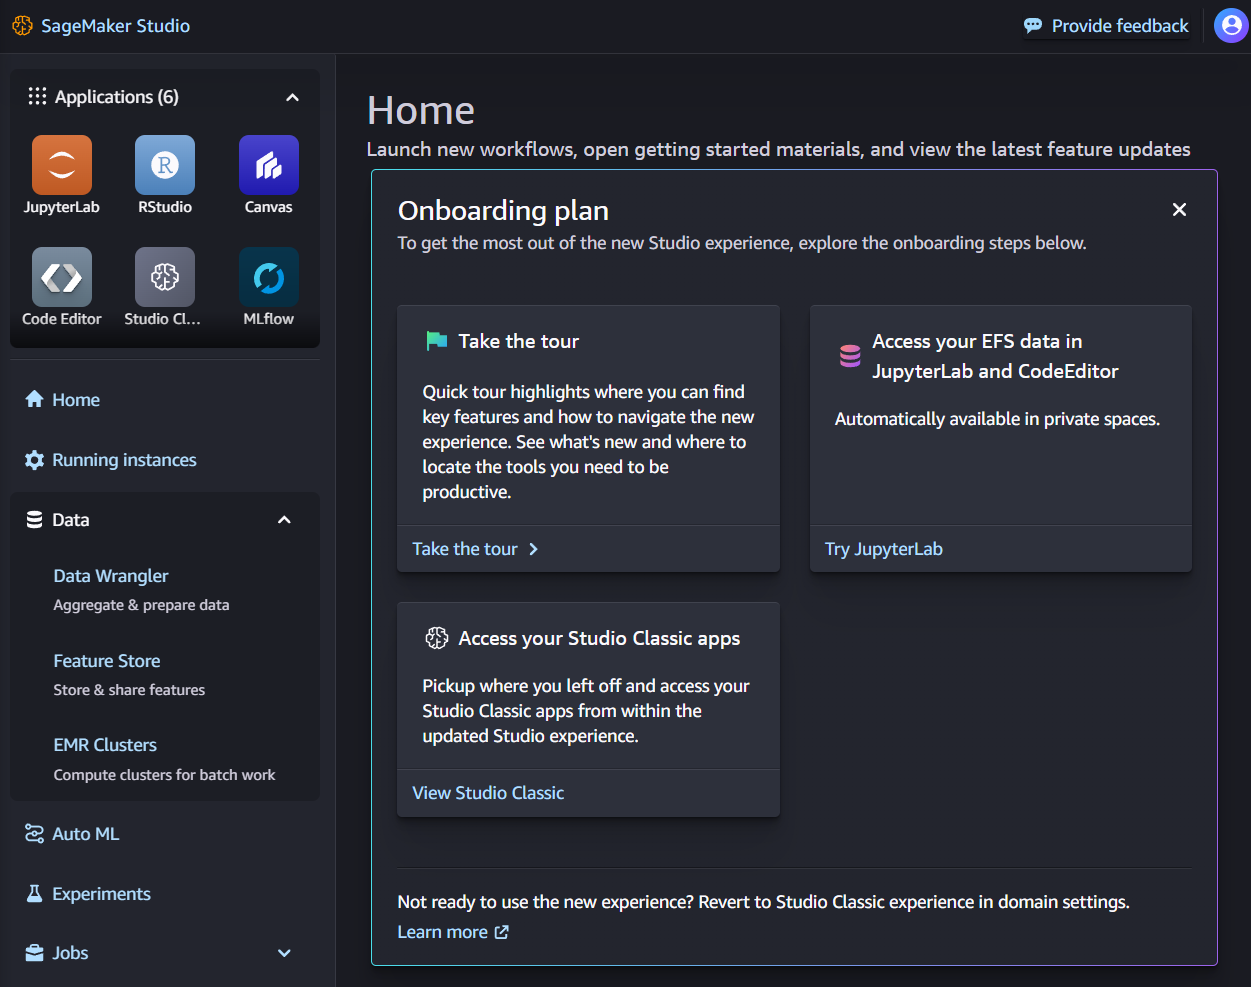
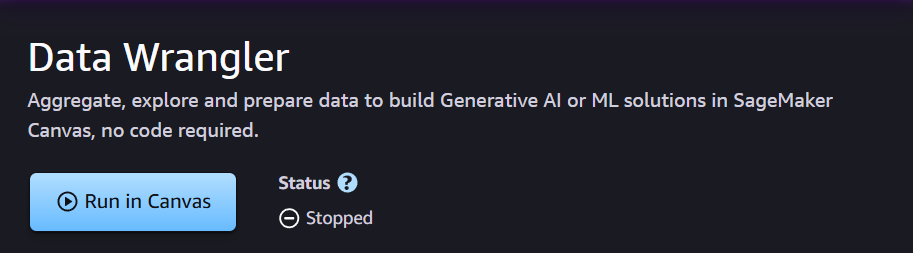
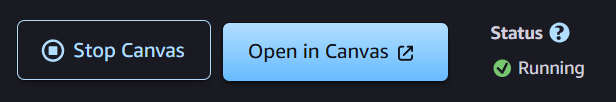
4) Click on "Run in Canvas". Canvas will be ready in about a minute for user profiles created after Mar 2024, and up to 8 mins for older user profiles. Then click on "Open in Canvas".
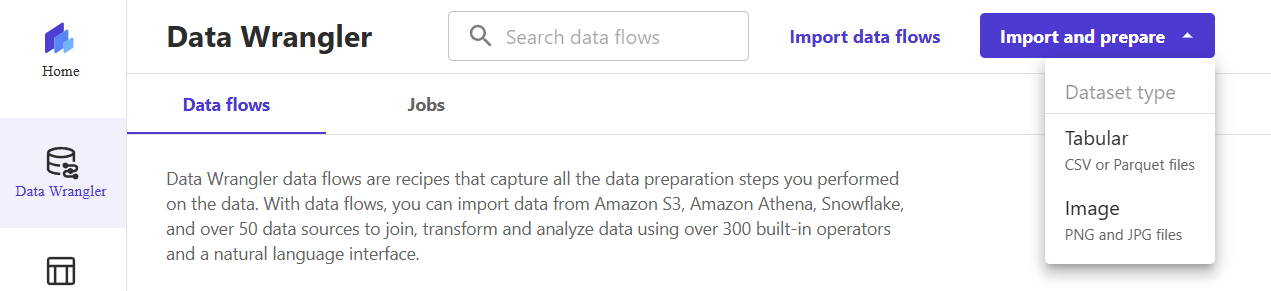
5) On the Data Wrangler screen, expand the top right menu "Import and prepare" and select "Tabular".
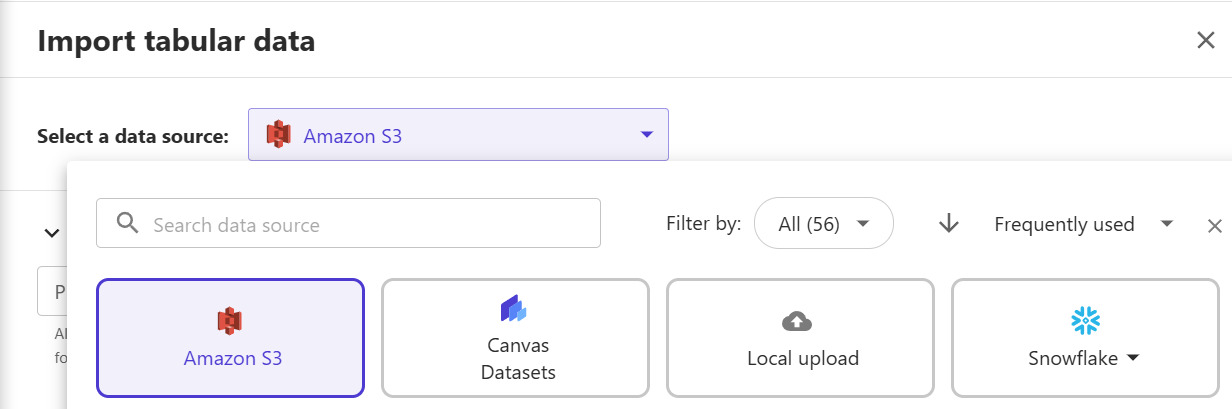
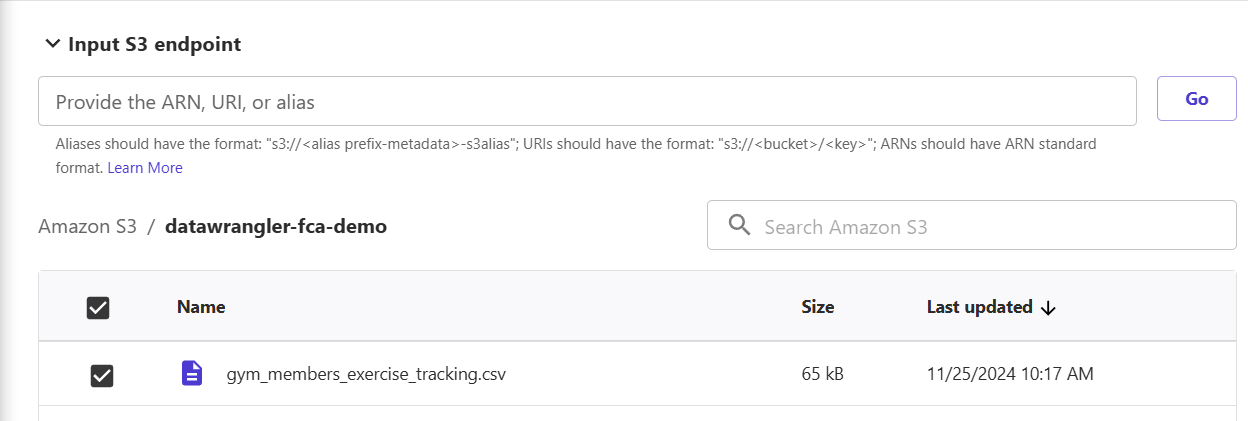
6) Select the data source as S3, then click on the bucket where the dataset is stored. In this example, it is datawrangler-fca-demo.
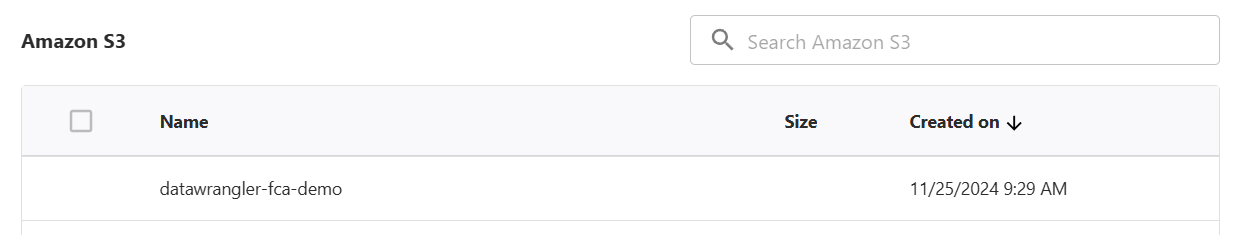
7) Pick the dataset to be imported and then click "Next".
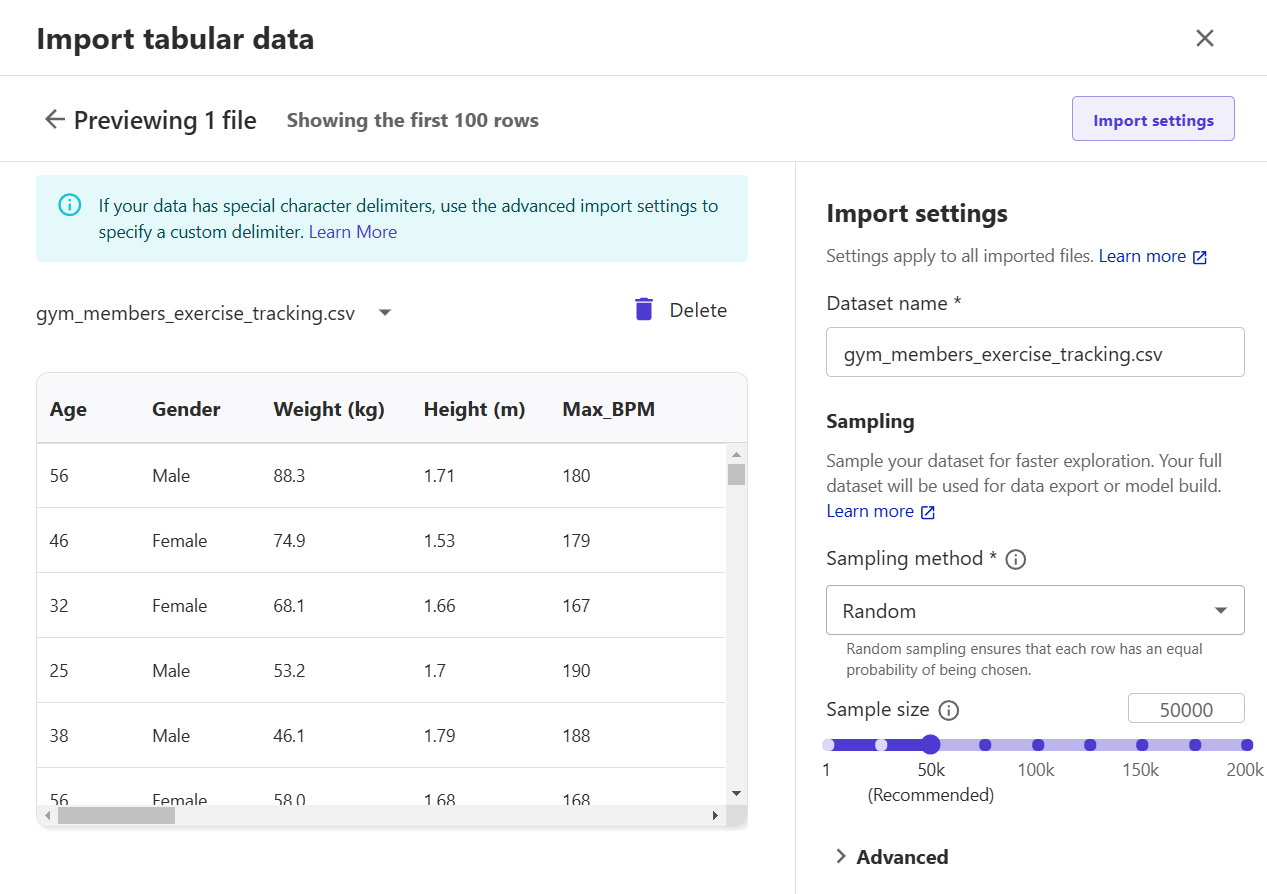
8) In the preview window, you will see the first 100 rows. Click "Import" to load data and create a simple data flow.
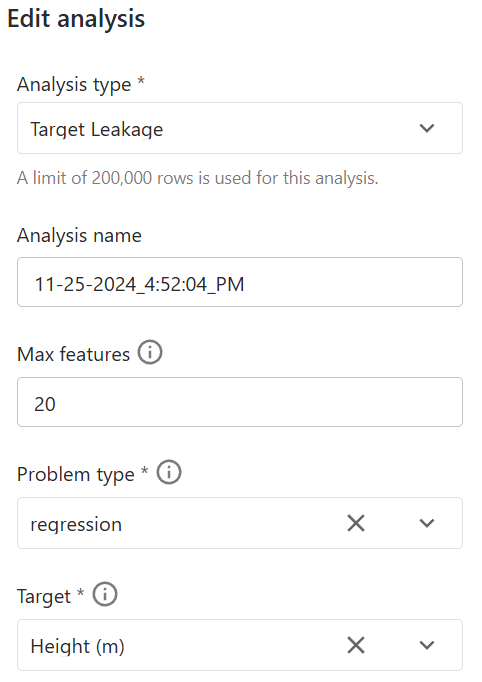
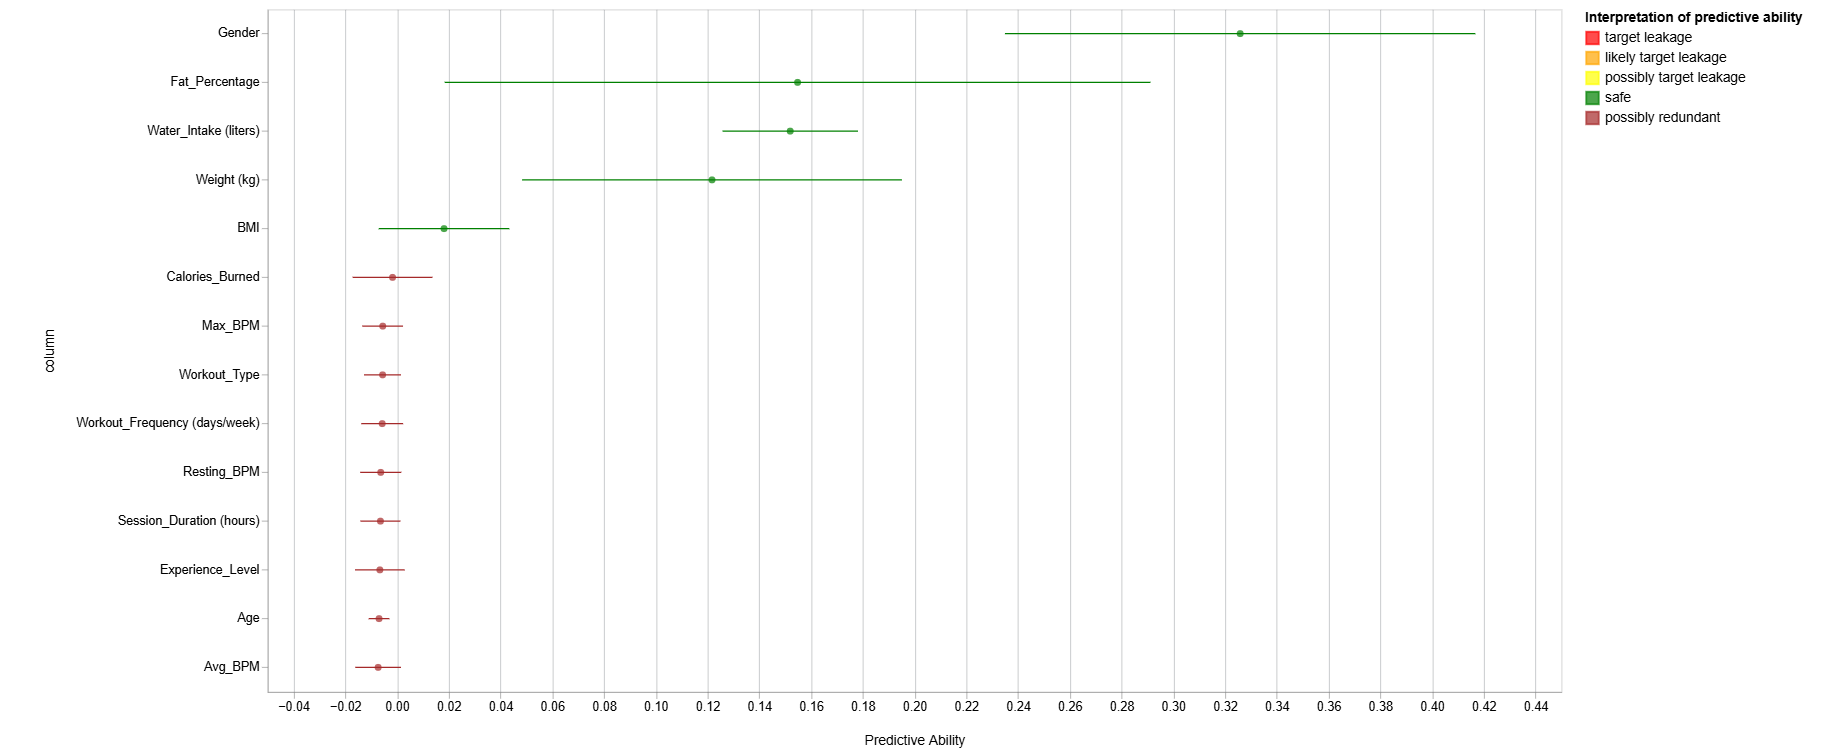
9) (Optional) Click on the "Analyses" tab, select analysis type "Target Leakage", problem type "regression", and target "Height". Click on "Create" and observe the results. A score of 1 indicates perfect predictive abilities, often indicating an error called target leakage. Experiment with other analysis types.
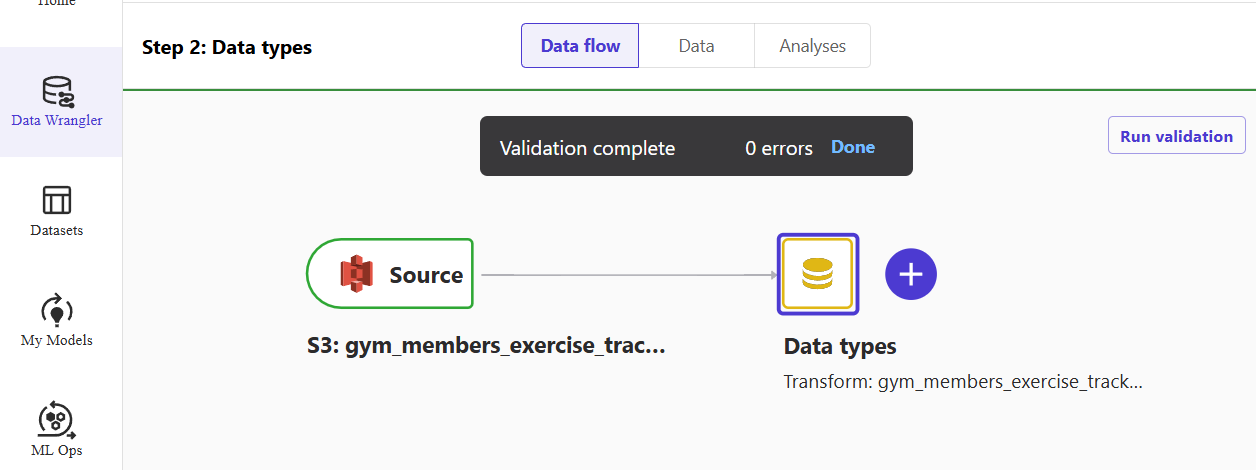
10) On the "Data flow" tab, click the big plus sign next to "Data type" to open a context menu. Select the "Add transform" menu.
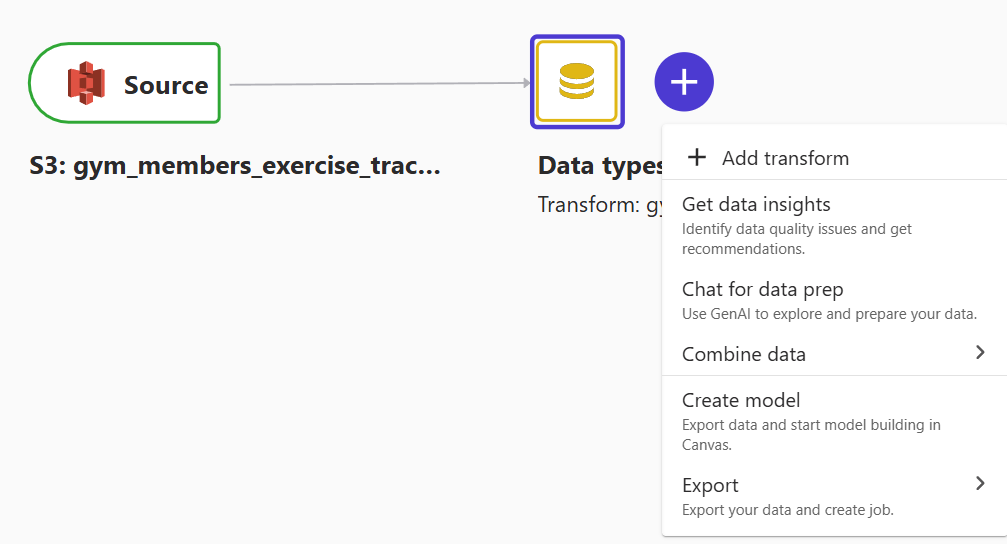
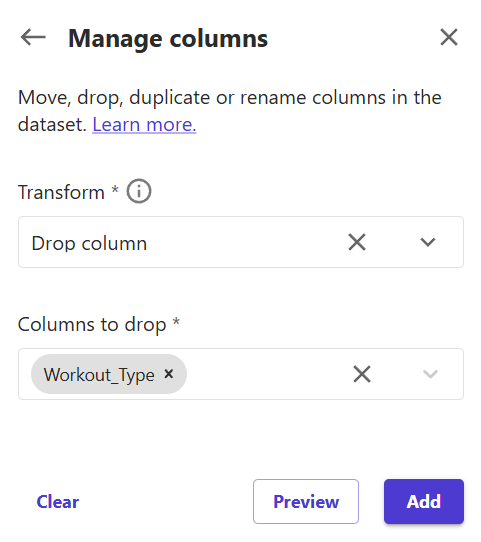
11) Let's drop the Workout_Type column from the dataset to see how transformation works. Click "Add transform" and write "Manage columns" in the search string.
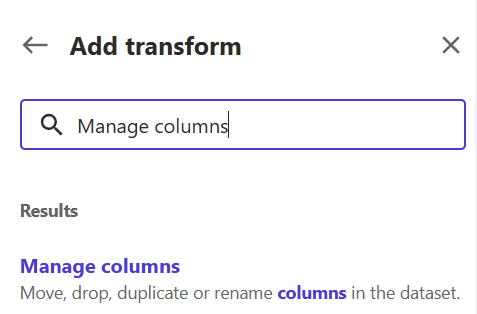
12) Set the transform field as "Drop column" and the column to drop as "Workout_Type". Click "Add" to add a transformation step in the data flow.
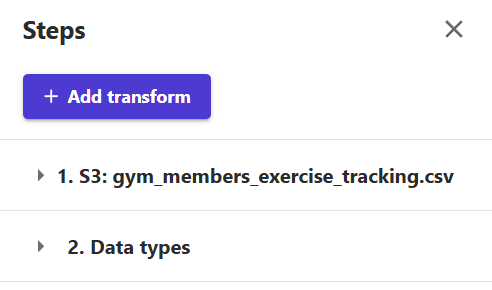
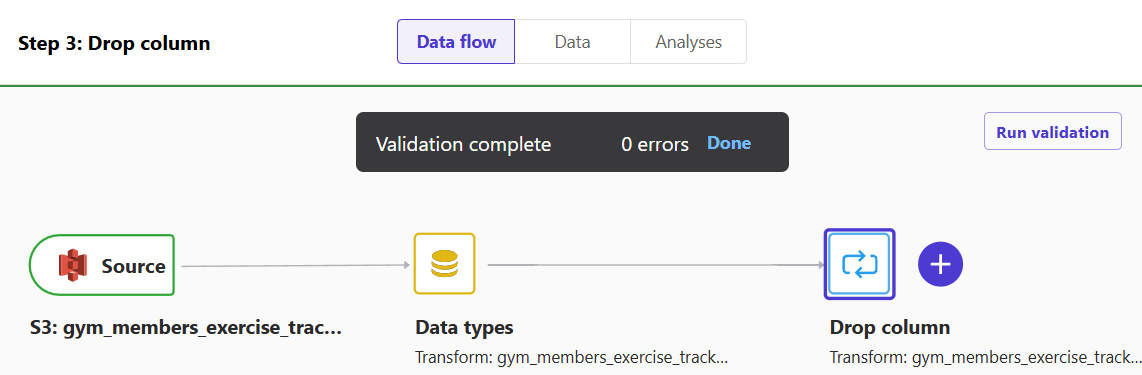
If you go back to the "Data flow" tab, you will see that the new step is now a part of the flow.
13) (Optional) If you want to experiment with custom transformation, click "Add transform" and write "Custom transform" in the search box. Name it, keep the selection as Python (PySpark), and in the "Your custom transform" type:
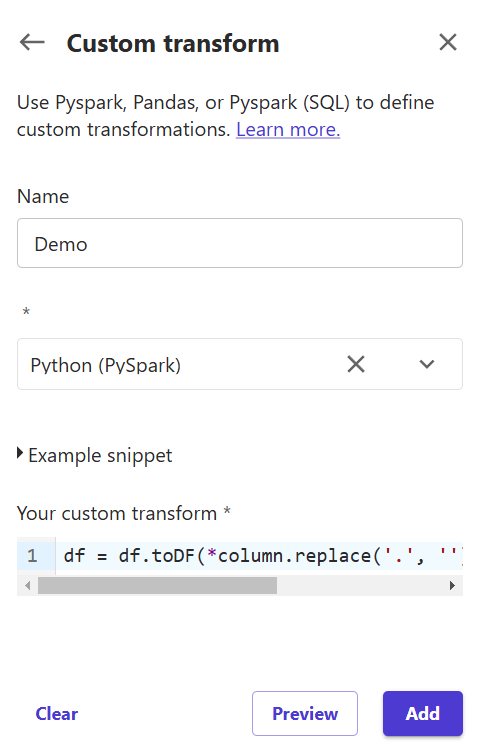
df = df.toDF(*column.replace('.', '') for column in df.columns))It will remove all dots from all columns. This Python transformation only makes a little sense except to show how to use custom scripts.
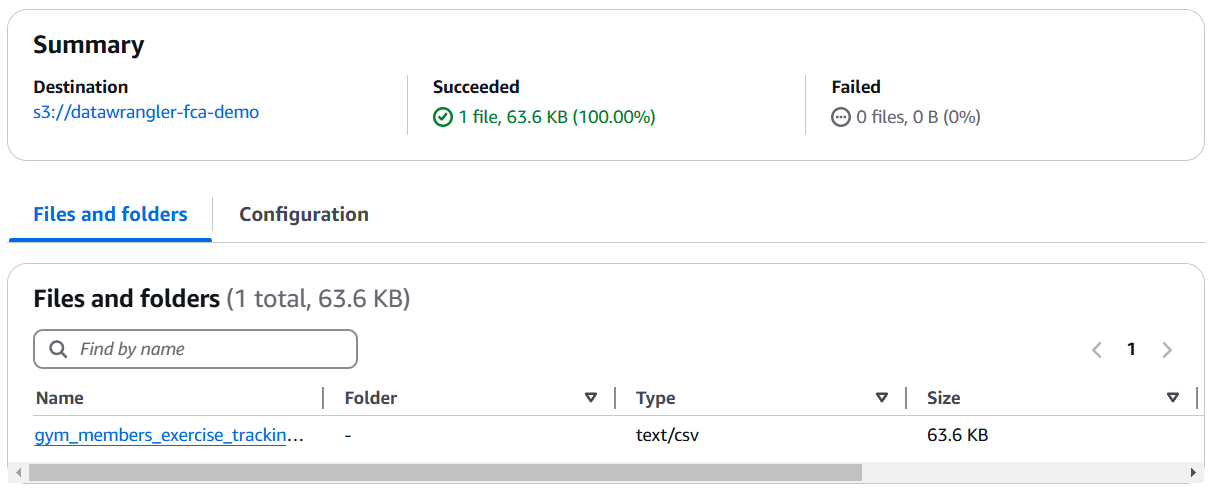
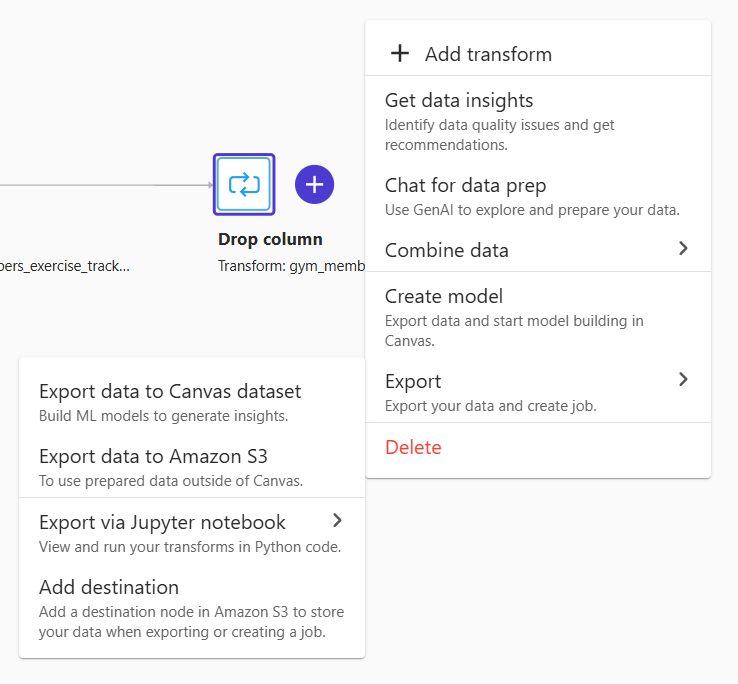
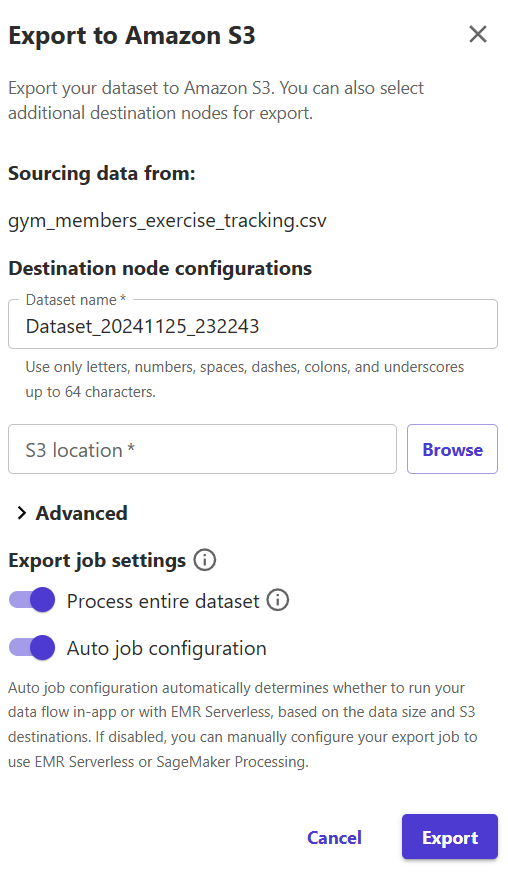
14) On the "Data flow" tab, click on the big plus sign again, but this time, it is next to the "Drop column". Select "Export" -> "Export data to Amazon S3".
15) Give the transformed dataset a new name or keep it as it. Select the S3 bucket where the results need to be uploaded. Click on "Export".
As you can see, Data Wrangler is quite a straightforward tool to use. Feel free to play with various datasets. Remember to release resources when no longer needed.
Looking for help? Reach me any time.